either a single string, or a vector of strings defining which reducers will be applied over which bands of the input cube
…
optional additional expressions (if expr is not a vector)
FUN
a user-defined R function applied over pixel time series (see Details)
names
character vector; names of the output bands, if FUN is provided, the length of names is used as the expected number of output bands
load_pkgs
logical or character; if TRUE, all currently attached packages will be attached automatically before executing FUN in spawned R processes, specific packages can alternatively be provided as a character vector.
load_env
logical or environment; if TRUE, the current global environment will be restored automatically before executing FUN in spawned R processes, can be set to a custom environment.
Details
The function can either apply a built-in reducer if expr is given, or apply a custom R reducer function if FUN is provided.
In the former case, notice that expressions have a very simple format: the reducer is followed by the name of a band in parantheses. You cannot add more complex functions or arguments. Possible reducers currently are “min”, “max”, “sum”, “prod”, “count”, “mean”, “median”, “var”, “sd”, “which_min”, “which_max”, “Q1” (1st quartile), and “Q3” (3rd quartile).
User-defined R reducer functions receive a two-dimensional array as input where rows correspond to the band and columns represent the time dimension. For example, one row is the time series of a specific band. FUN should always return a numeric vector with the same number of elements, which will be interpreted as bands in the result cube. Notice that it is recommended to specify the names of the output bands as a character vector. If names are missing, the number and names of output bands is tried to be derived automatically, which may fail in some cases.
Implemented reducers will ignore any NAN values (as na.rm=TRUE does)
This function returns a proxy object, i.e., it will not start any computations besides deriving the shape of the result.
Examples
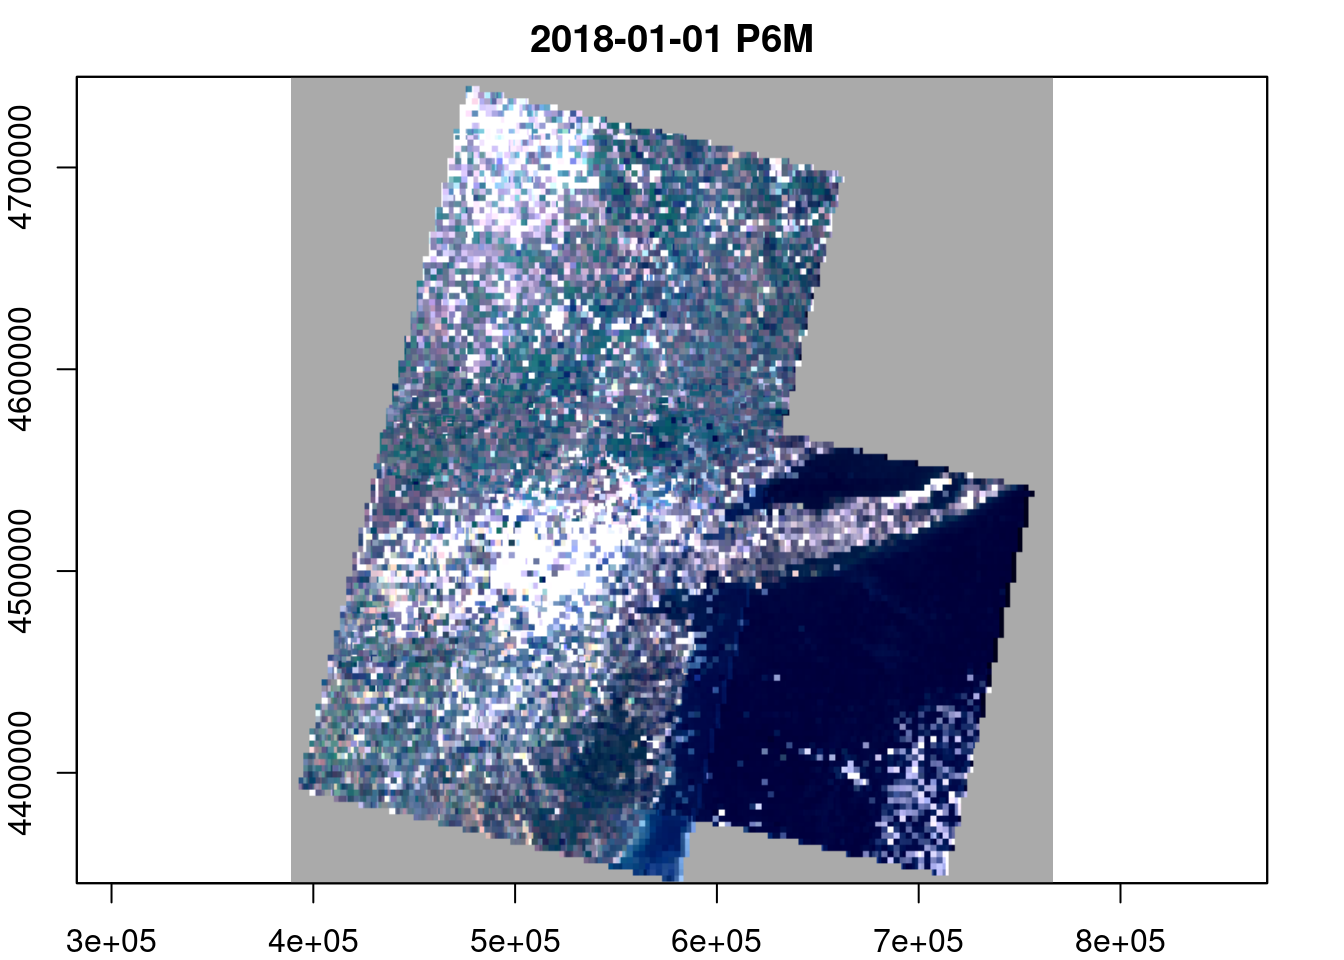
# create image collection from example Landsat data only # if not already done in other examplesif (!file.exists(file.path(tempdir(), "L8.db"))) { L8_files <-list.files(system.file("L8NY18", package ="gdalcubes"),".TIF", recursive =TRUE, full.names =TRUE)create_image_collection(L8_files, "L8_L1TP", file.path(tempdir(), "L8.db"), quiet =TRUE) }L8.col =image_collection(file.path(tempdir(), "L8.db"))v =cube_view(extent=list(left=388941.2, right=766552.4, bottom=4345299, top=4744931, t0="2018-01", t1="2018-06"),srs="EPSG:32618", nx =497, ny=526, dt="P1M")L8.cube =raster_cube(L8.col, v) L8.rgb =select_bands(L8.cube, c("B02", "B03", "B04"))L8.rgb.median =reduce_time(L8.rgb, "median(B02)", "median(B03)", "median(B04)") L8.rgb.median
A data cube proxy object

Dimensions:
         low       high count       pixel_size chunk_size
t 2018-01-01 2018-06-30     1              P6M          1
y    4345299    4744931   526 759.756653992395        384
x   388941.2   766552.4   497 759.781086519115        384

Bands:
        name offset scale nodata unit
1 B02_median      0     1    NaN
2 B03_median      0     1    NaN
3 B04_median      0     1    NaN
plot(L8.rgb.median, rgb=3:1)
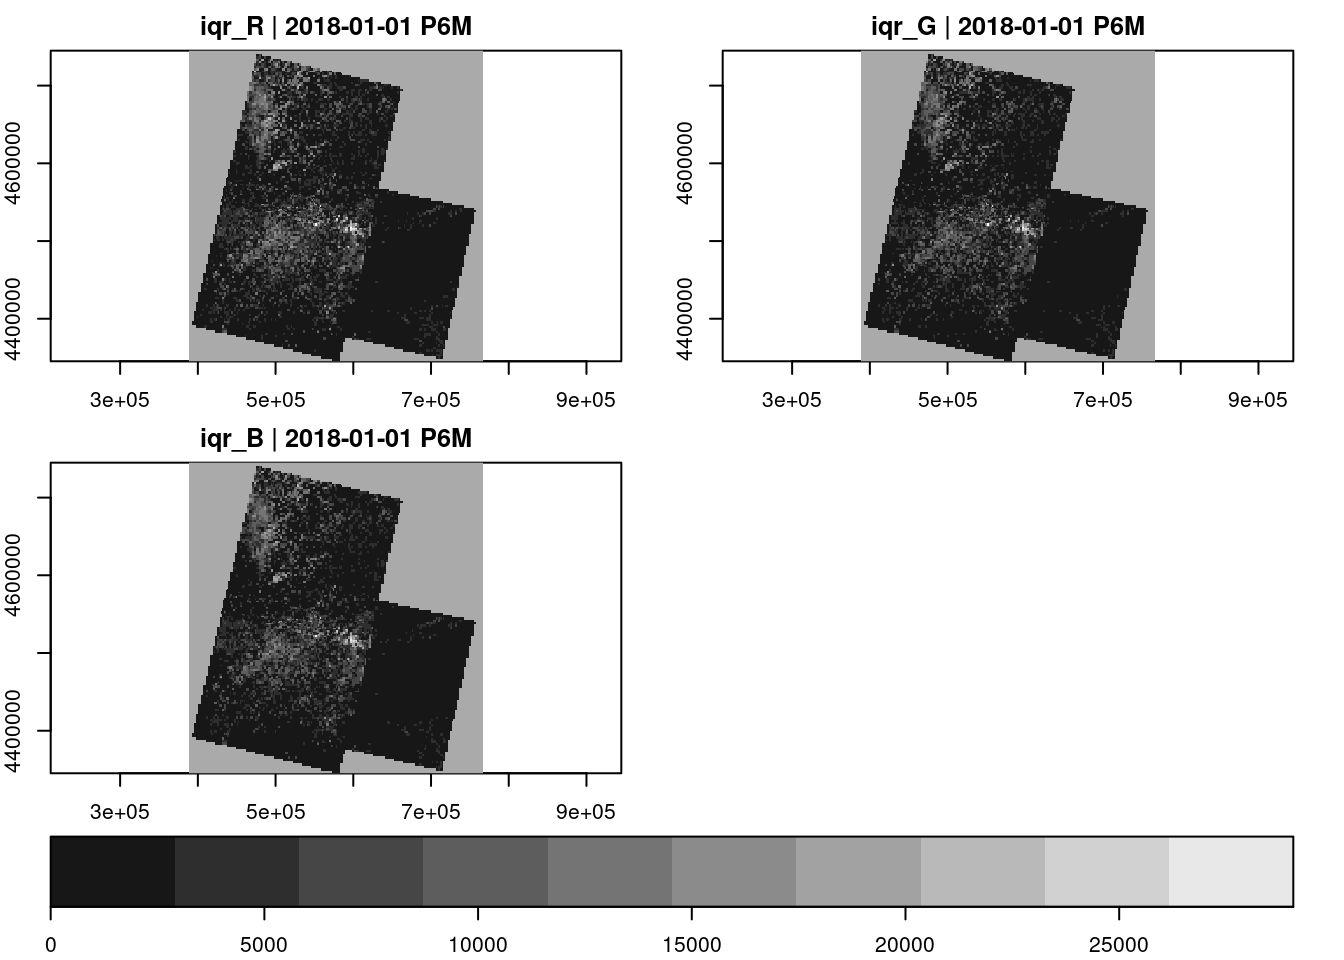
# user defined reducer calculating interquartile rangesL8.rgb.iqr =reduce_time(L8.rgb, names=c("iqr_R", "iqr_G","iqr_B"), FUN =function(x) {c(diff(quantile(x["B04",],c(0.25,0.75), na.rm=TRUE)),diff(quantile(x["B03",],c(0.25,0.75), na.rm=TRUE)),diff(quantile(x["B02",],c(0.25,0.75), na.rm=TRUE)))})L8.rgb.iqr
A data cube proxy object

Dimensions:
         low       high count       pixel_size chunk_size
t 2018-01-01 2018-06-30     1              P6M          1
y    4345299    4744931   526 759.756653992395        384
x   388941.2   766552.4   497 759.781086519115        384

Bands:
   name offset scale nodata unit
1 iqr_R      0     1    NaN
2 iqr_G      0     1    NaN
3 iqr_B      0     1    NaN
plot(L8.rgb.iqr, key.pos=1)
Source Code
# reduce_time.cubeReduce a data cube over the time dimension```{r include=FALSE}library(gdalcubes)```## DescriptionCreate a proxy data cube, which applies one or more reducer functions to selected bands over pixel time series of a data cube## Usage```rreduce_time.cube( x, expr, ..., FUN,names =NULL,load_pkgs =FALSE,load_env =FALSE)```## Arguments| Argument | Description ||:------------|:----------------------------------|| x | source data cube || expr | either a single string, or a vector of strings defining which reducers will be applied over which bands of the input cube || ... | optional additional expressions (if `expr` is not a vector) || FUN | a user-defined R function applied over pixel time series (see Details) || names | character vector; names of the output bands, if FUN is provided, the length of names is used as the expected number of output bands || load_pkgs | logical or character; if TRUE, all currently attached packages will be attached automatically before executing FUN in spawned R processes, specific packages can alternatively be provided as a character vector. || load_env | logical or environment; if TRUE, the current global environment will be restored automatically before executing FUN in spawned R processes, can be set to a custom environment. |## DetailsThe function can either apply a built-in reducer if expr is given, or apply a custom R reducer function if FUN is provided.In the former case, notice that expressions have a very simple format: the reducer is followed by the name of a band in parantheses. You cannot addmore complex functions or arguments. Possible reducers currently are "min", "max", "sum", "prod", "count", "mean", "median", "var", "sd", "which_min", "which_max","Q1" (1st quartile), and "Q3" (3rd quartile).User-defined R reducer functions receive a two-dimensional array as input where rows correspond to the band and columns represent the time dimension. For example, one row is the time series of a specific band. FUN should always return a numeric vector with the same number of elements, which will be interpretedas bands in the result cube. Notice that it is recommended to specify the names of the output bands as a character vector. If names are missing,the number and names of output bands is tried to be derived automatically, which may fail in some cases. For more details and examples on how to write user-defined functions, please refer to the gdalcubes website at [https://gdalcubes.github.io/source/concepts/udfs.html](https://gdalcubes.github.io/source/concepts/udfs.html).## Valueproxy data cube object## NoteImplemented reducers will ignore any NAN values (as na.rm=TRUE does)This function returns a proxy object, i.e., it will not start any computations besides deriving the shape of the result.## Examples```{r}# create image collection from example Landsat data only # if not already done in other examplesif (!file.exists(file.path(tempdir(), "L8.db"))) { L8_files <-list.files(system.file("L8NY18", package ="gdalcubes"),".TIF", recursive =TRUE, full.names =TRUE)create_image_collection(L8_files, "L8_L1TP", file.path(tempdir(), "L8.db"), quiet =TRUE) }L8.col =image_collection(file.path(tempdir(), "L8.db"))v =cube_view(extent=list(left=388941.2, right=766552.4, bottom=4345299, top=4744931, t0="2018-01", t1="2018-06"),srs="EPSG:32618", nx =497, ny=526, dt="P1M")L8.cube =raster_cube(L8.col, v) L8.rgb =select_bands(L8.cube, c("B02", "B03", "B04"))L8.rgb.median =reduce_time(L8.rgb, "median(B02)", "median(B03)", "median(B04)") L8.rgb.medianplot(L8.rgb.median, rgb=3:1)# user defined reducer calculating interquartile rangesL8.rgb.iqr =reduce_time(L8.rgb, names=c("iqr_R", "iqr_G","iqr_B"), FUN =function(x) {c(diff(quantile(x["B04",],c(0.25,0.75), na.rm=TRUE)),diff(quantile(x["B03",],c(0.25,0.75), na.rm=TRUE)),diff(quantile(x["B02",],c(0.25,0.75), na.rm=TRUE)))})L8.rgb.iqrplot(L8.rgb.iqr, key.pos=1)```