character; new temporal resolution, datetime period string, e.g. “P1M”
method
aggregation method, one of “mean”, “min”, “max”, “median”, “count”, “sum”, “prod”, “var”, and “sd”
fact
simple integer factor defining how many cells become aggregated to a single new cell, can be used instead of dt
Details
This function can be used to aggregate time series to lower resolution or to regularize a data cube with irregular (labeled) time axis. It is possible to change the unit of the temporal resolution (e.g. to create monthly composites from daily images). The size of the cube may be expanded automatically if the original temporal extent is not divisible by the new temporal size of pixels.
Note
This function returns a proxy object, i.e., it will not start any computations besides deriving the shape of the result.
Examples
# create image collection from example Landsat data only # if not already done in other examplesif (!file.exists(file.path(tempdir(), "L8.db"))) { L8_files <-list.files(system.file("L8NY18", package ="gdalcubes"),".TIF", recursive =TRUE, full.names =TRUE)create_image_collection(L8_files, "L8_L1TP", file.path(tempdir(), "L8.db"), quiet =TRUE) }L8.col =image_collection(file.path(tempdir(), "L8.db"))v =cube_view(extent=list(left=388941.2, right=766552.4, bottom=4345299, top=4744931, t0="2018-01", t1="2018-12"),srs="EPSG:32618", nx =497, ny=526, dt="P3M", aggregation ="median")L8.cube =raster_cube(L8.col, v, mask=image_mask("BQA", bits=4, values=16))L8.rgb =select_bands(L8.cube, c("B02", "B03", "B04"))L8.two_monthly =aggregate_time(L8.rgb, "P6M", "min")L8.two_monthly
A data cube proxy object

Dimensions:
         low       high count       pixel_size chunk_size
t 2018-01-01 2018-12-31     2              P6M          1
y    4345299    4744931   526 759.756653992395        384
x   388941.2   766552.4   497 759.781086519115        384

Bands:
  name offset scale nodata unit
1  B02      0     1    NaN
2  B03      0     1    NaN
3  B04      0     1    NaN
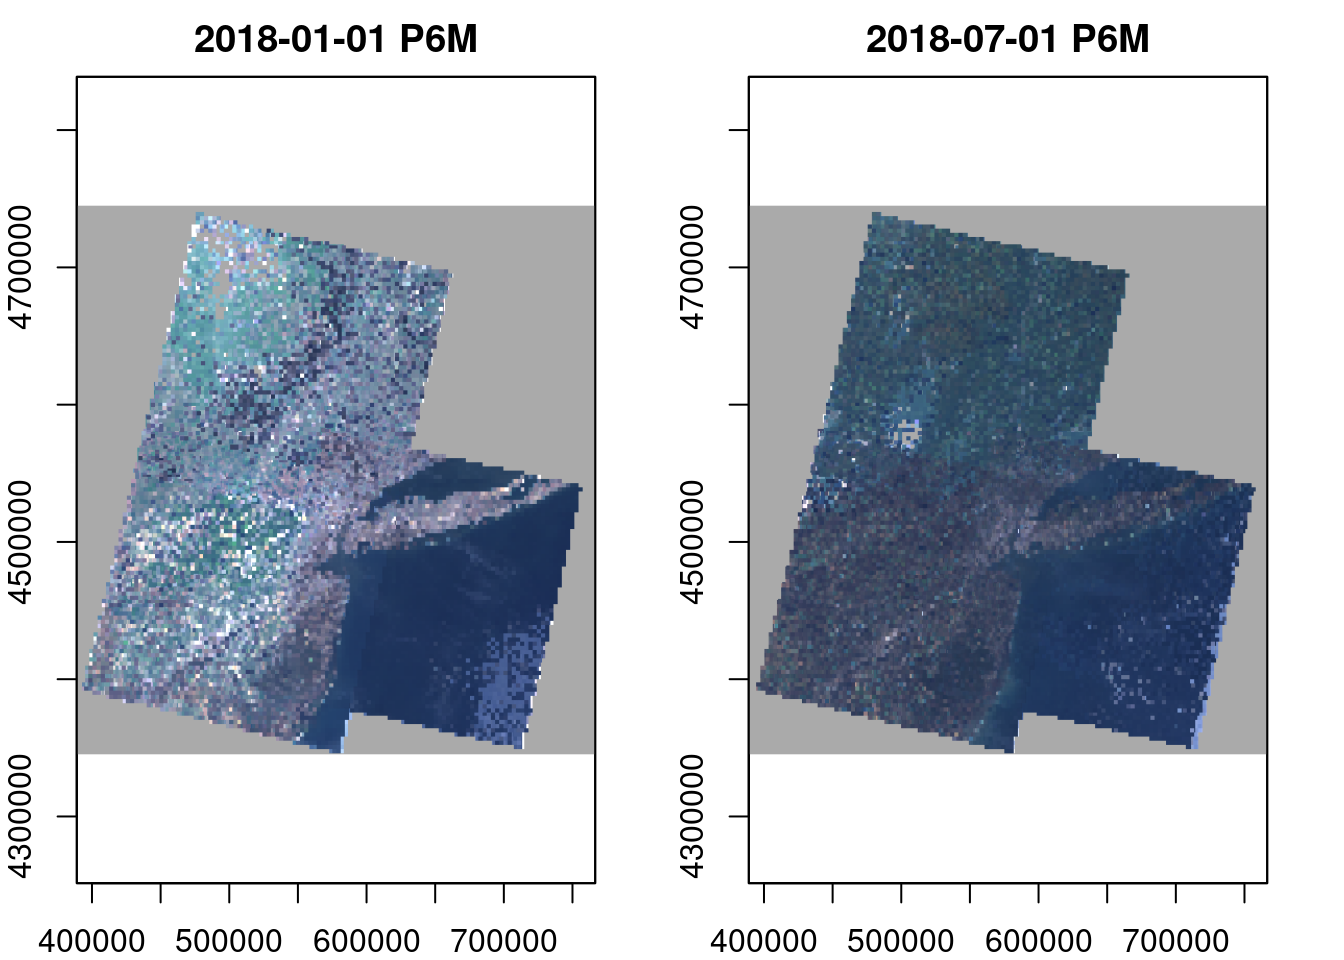
plot(L8.two_monthly, rgb=3:1, zlim=c(5000,12000))
Source Code
# aggregate_timeAggregate data cube time series to lower temporal resolution```{r include=FALSE}library(gdalcubes)```## DescriptionCreate a proxy data cube, which applies an aggregation function over pixel time series to lower temporal resolution.## Usage```raggregate_time(cube, dt, method ="mean", fact =NULL)```## Arguments| Argument | Description ||:------------|:----------------------------------|| cube | source data cube || dt | character; new temporal resolution, datetime period string, e.g. "P1M" || method | aggregation method, one of "mean", "min", "max", "median", "count", "sum", "prod", "var", and "sd" || fact | simple integer factor defining how many cells become aggregated to a single new cell, can be used instead of dt |## DetailsThis function can be used to aggregate time series to lower resolution or to regularizea data cube with irregular (labeled) time axis. It is possible to change the unit of the temporal resolution (e.g. to create monthly composites from daily images).The size of the cube may be expanded automatically if the original temporal extent is not divisible by the new temporal size of pixels.## NoteThis function returns a proxy object, i.e., it will not start any computations besides deriving the shape of the result.## Examples```{r}# create image collection from example Landsat data only # if not already done in other examplesif (!file.exists(file.path(tempdir(), "L8.db"))) { L8_files <-list.files(system.file("L8NY18", package ="gdalcubes"),".TIF", recursive =TRUE, full.names =TRUE)create_image_collection(L8_files, "L8_L1TP", file.path(tempdir(), "L8.db"), quiet =TRUE) }L8.col =image_collection(file.path(tempdir(), "L8.db"))v =cube_view(extent=list(left=388941.2, right=766552.4, bottom=4345299, top=4744931, t0="2018-01", t1="2018-12"),srs="EPSG:32618", nx =497, ny=526, dt="P3M", aggregation ="median")L8.cube =raster_cube(L8.col, v, mask=image_mask("BQA", bits=4, values=16))L8.rgb =select_bands(L8.cube, c("B02", "B03", "B04"))L8.two_monthly =aggregate_time(L8.rgb, "P6M", "min")L8.two_monthlyplot(L8.two_monthly, rgb=3:1, zlim=c(5000,12000))```